Tag: CDE
-
Master’s Thesis: Map Animation Videos

Objectives Despite continuous improvements, the possibilities for creating cartographic animations in GIS software are limited compared to dedicated animation tools. The software Adobe After Effects is considered an industry leader when it comes to motion graphics, visual effects and the creation of professional animations. This thesis aimed to combine the value and power of spatial…
-
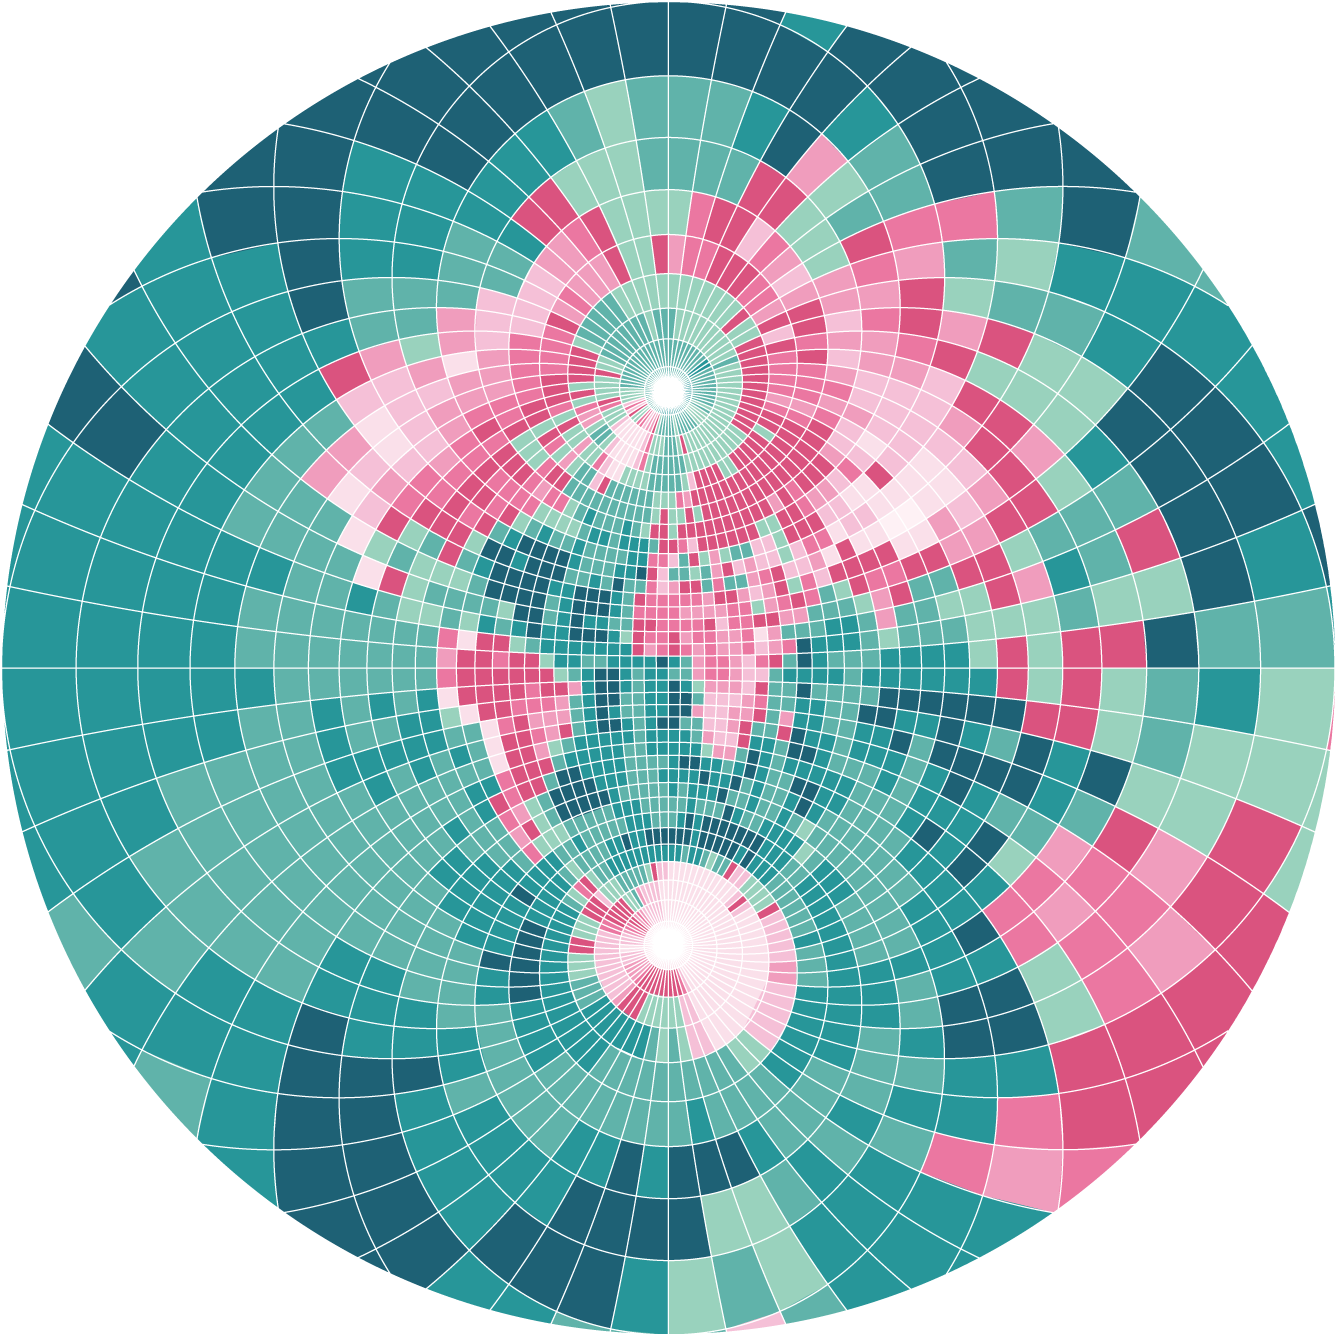
Poster about Me and my Home Country

This poster was created as the final project for the course Thematic Cartography in my third semester of CDE. For the final project of the Thematic Cartography course, the students were asked to use the skills they had acquired during the semester to independently create a poster from scratch. The poster had to include three…
-
Principles of Geovisualization in Map Animations
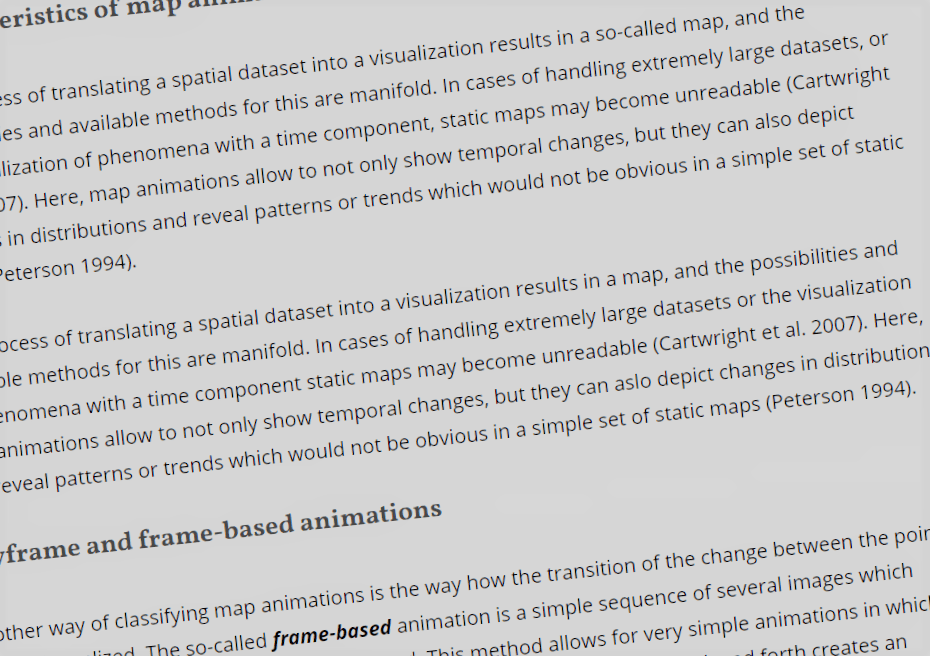
This short scientific essay was written for the course Principles of geovisualization in my third semester of CDE. Characteristics of map animations The process of translating a spatial dataset into a visualization results in a so-called map, and the possibilities and available methods for this are manifold. In cases of handling extremely large datasets, or…
-
Geospatial Christmas Tree Animation

This illustration was created for the course Desktop Publishing in Cartography in my third semester of CDE. The animation was created to get familiar with Adobe After Effects to prepare for the Master Thesis. Illustration Whether you have participated in the tradition yourself or have received postings or letters from companies, the tradition of greeting…
-
Physical Map of Czechia
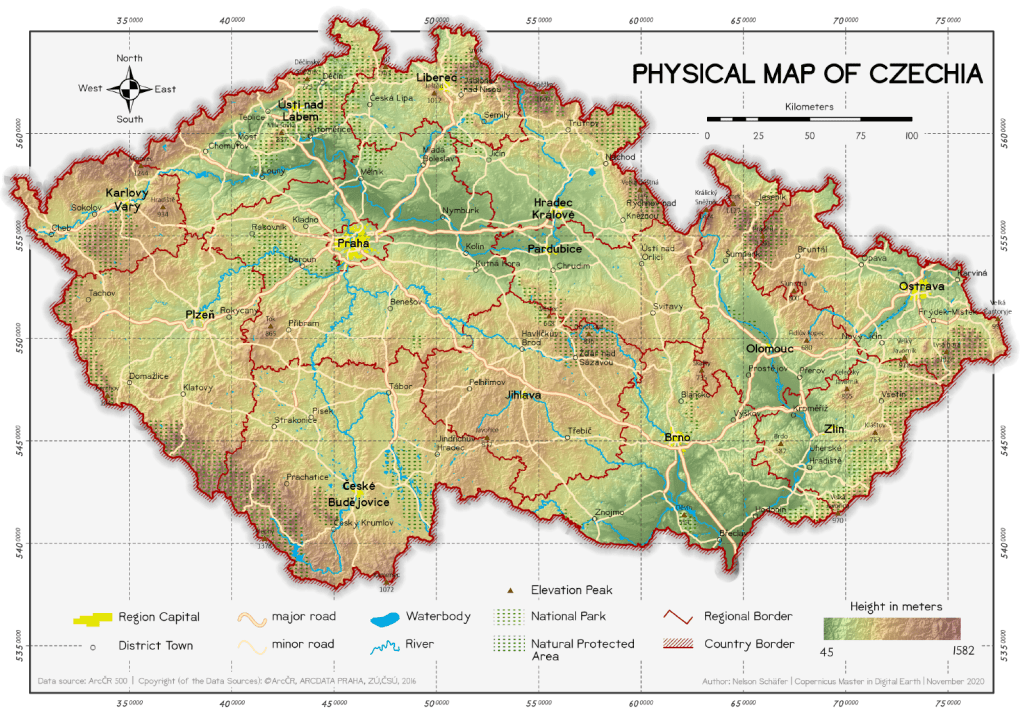
This map was created in the course Thematic Cartography in my third semester of CDE. Physical Maps are the best way to provide an complete overview on the characteristic features of a country. The main content of this map is the topographic baselayer, describing the elevation distribution with a coloured gradient, additional hillshade and labeled…
-
Seminar Paper on BOA Image Calibration & Topographic Correction

This seminar paper was written in the course Analysis & Modelling (Remote Sensing) in my second semester of CDE. Raw image data derived from satellites is in many cases not ready to be used for analyses or calculations. Often a series of pre-processing steps is necessary to prepare the image data for the actual study…
-
Thematic Maps with Graduated & Proportional Symbols

This set of maps was created in the course Thematic Cartography in my third semester of CDE. For this assignment, two thematic maps were created that show key figures of the population in the Czech Republic. The main objective was to understand the difference between graduated and proportional symbols in thematic cartography. I. Births and…
-
Map Posters

These maps were created in the courses Design in Geovisualization and Desktop Publishing in Cartography in my third semester of CDE. As a large number of providers on the Internet prove, it is a contemporary trend to hang up map posters in your own home. The design of such maps consists often of a simple…
-
Old Map Design
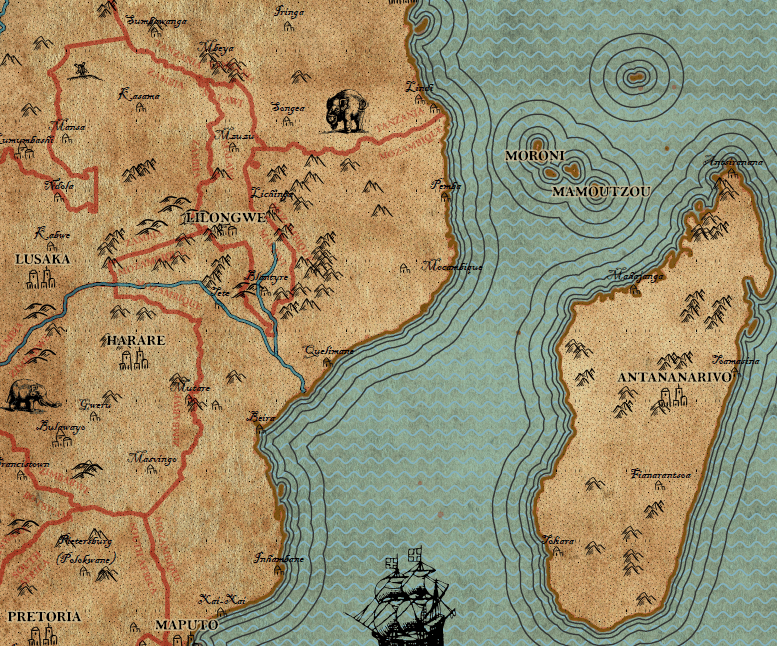
This map was created in the course Design in Geovisualization in my third semester of CDE. Following to a lecture on the history of cartography and the presentation of many old maps, an own map had to be created in the style of the vintage maps. With a given dataset of a part of Africa…
-
Choropleth Maps on the population of the Czech Republic
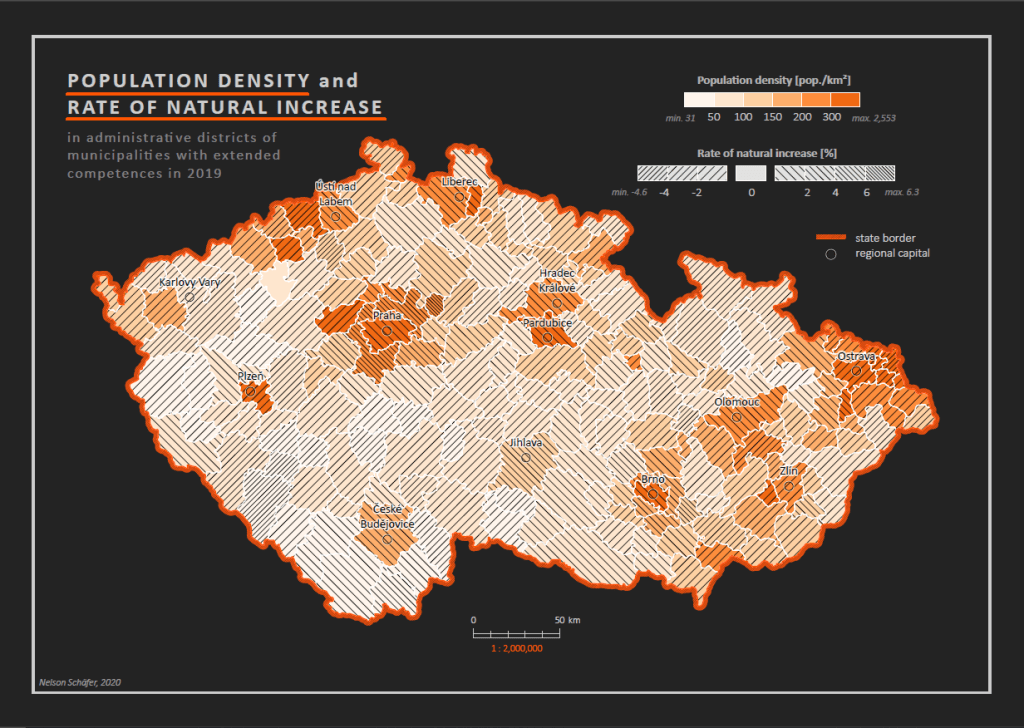
This set of maps was created in the course Thematic Cartography in my third semester of CDE. For this assignment, a number of thematic choropleth maps were created that show key figures of the population in the Czech Republic. The four maps show different methods how statistical data can be visualized and presented. Map 1:…
-
3D Terrain Model of Tenerife + 3D print

This model was created in the course Design in Geovisualization in my third semester of CDE. In this project I created a 3D model of the topography of the island Tenerife, which is part of the Spanish Canary Islands. I used SRTM raster height data from OpenTopography.org and created a 3D terrain model with the…
-
Bird Map of Smetanovy Sady
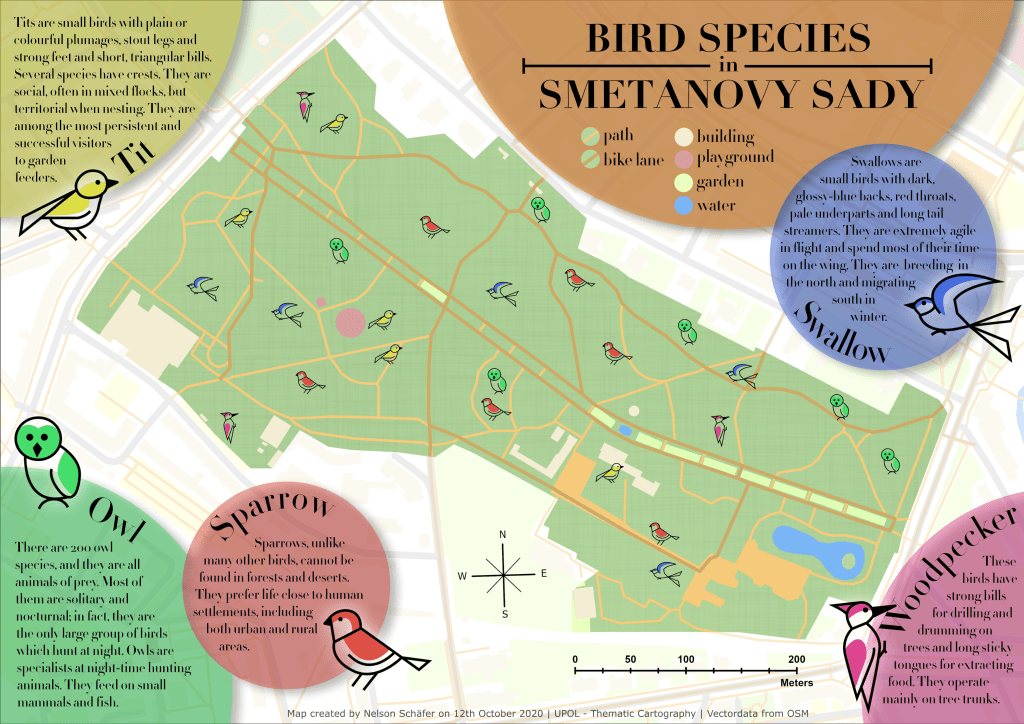
This map was created in the course Design in Geovisualization in my third semester of CDE. The idea of this project was to gain experience in designing a map that goes beyond the ordinary possibilities that are usually used in GIS software like ArcGIS Pro. For the fictional topic of bird species in a public…
-
Miscellaneous simple maps
During my time at the Department for Geoinformatics at UPOL, a large number of maps were created from small projects or tasks. This post is a collection of simple maps that I consider worth sharing for a variety of reasons. I. Travel Map from text description This map was the first map that I created…
-
Internship at eoVision

In the lecture-free period between the second and third semester of CDE I pursued the mandatory 8-week internship. The company I chose is eoVision. It is located in Salzburg and is working on creating and publishing products like books, atlases, maps or calendars using geodata and especially remotely sensed image products. Apart from that, the…
-
Air Traffic Distribution Analysis Application

This web application was created in the course SDI Services Implementation in the second semester of CDE. As long as the created web app has not been deleted from the university servers, you can find it here. Along with the ongoing shift of storing, distributing, and analyzing spatial data online and in web GIS environments,…
-
Cartography. MOOC

The Esri MOOC Cartography. is a six-week online course on cartographic principles and on creating maps in various output formats using ArcGIS Pro. The first lessons of this MOOC were about creating two-dimensional maps and explaining various basic principles that need to be considered for good cartographic design. The courses gave insight on designing visually…
-
Methods in Spatial Analysis

This set of assignments was created in the course Methods in Spatial Analysis in my first semester of CDE. For a series of assignments in this course a ArcGIS storymap was created to present the results of each project. Click on the links to see the story maps with detailed descriptions and explanations:
-
Time Series Visualisation with Java

This application was created in the course Software Development in the first semester of CDE. The objective of this exercise was to create a Java-based program that displays Twitter data stored in a PostgreSQL database and physiological measurement data stored in a WFS database. The data was animated as a time series and displayed on…
-
Web Flow Map of bicycle sharing data

This map was created in the course Geovisualization and Advanced Cartography in the first semester of CDE. This project deals with the visualisation of bike sharing data from BLUEbikes in Boston, Massachussets. BLUEbikes provides rich system data for free use on their website. The flow of BLUEbikes users renting a bike at one station and…
-
Web Map of Lake Hallstatt

This map was created in the course Geovisualization and Advanced Cartography in the first semester of CDE. This project is a continuation of the static Tourist Map of Lake Hallstatt. The goal was to translate the information of a static map into an interactive web map application. For creating the web map the JavaScript library…
-
Tourist Map of Lake Hallstatt

This map was created in the course Geovisualization and Advanced Cartography in the first semester of CDE. This project was titled All about lakes and had the aim of creating a map of any chosen lake while applying cartographic principles. One of the most famous lakes in Austria is Lake Hallstatt, which is part of…
