This web application was created in the course SDI Services Implementation in the second semester of CDE.
Along with the ongoing shift of storing, distributing, and analyzing spatial data online and in web GIS environments, the need for standardized, efficient, and flexible ways of connecting these services becomes crucial. Spatial data infrastructures (SDI) follow the idea of creating harmonized environments and services to enable easy and open sharing and connecting of geospatial data and tools between different parties from different sources.
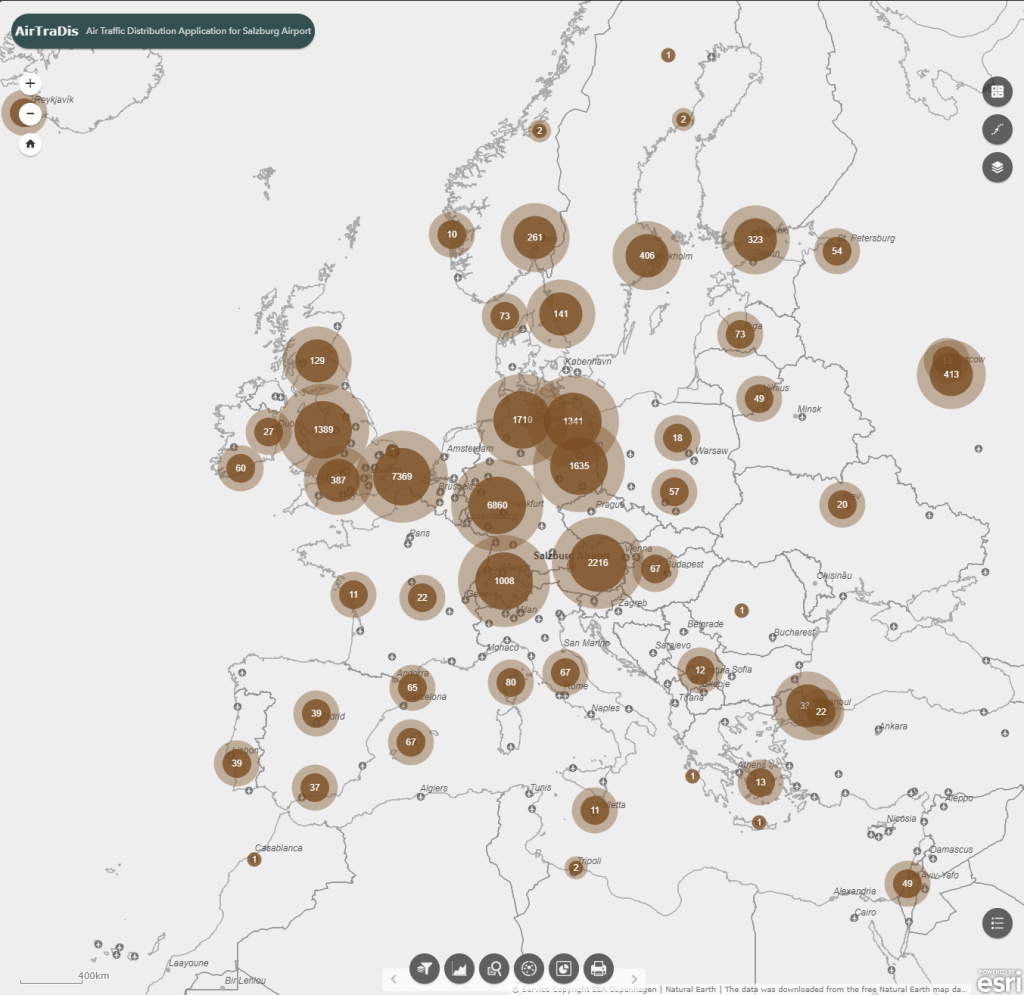
The consequences of COVID-19 pandemic lead to drastic changes in flight traffic. Therefore, the web application developed in this course had the goal to visualize the impact of the pandemic on the spatial distribution and the change of directional trends on flights going in and out of the Salzburg Airport during that time.
Since the focus of this course was on SDIs, a big part of the work consisted of creating OGC and ISO compliant map services which included rich metadata and were openly accessible. Finally, all these services were brought together in an interactive web application.
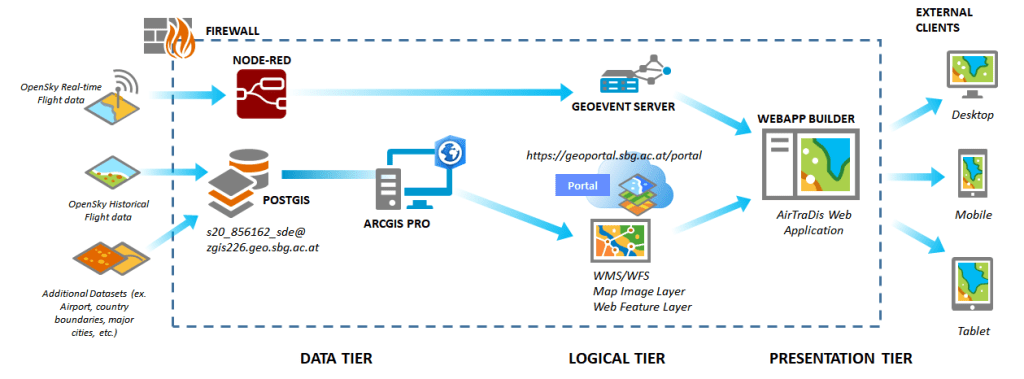
The resulting web application contains real-time data on air traffic, self-published WFS services, results of statistical calculations and interactive analysis tools.


To visualize the change in the direction and dispersion of air traffic during the COVID-19 pandemic the statistical measurement of Standard Deviational Ellipses was used. In the following figure you can see the ellipses of 2019 in green and the ellipses of 2020 in red. The results show a clear centralization and less dispersion in the month of May 2020 compared to the same month of 2019.

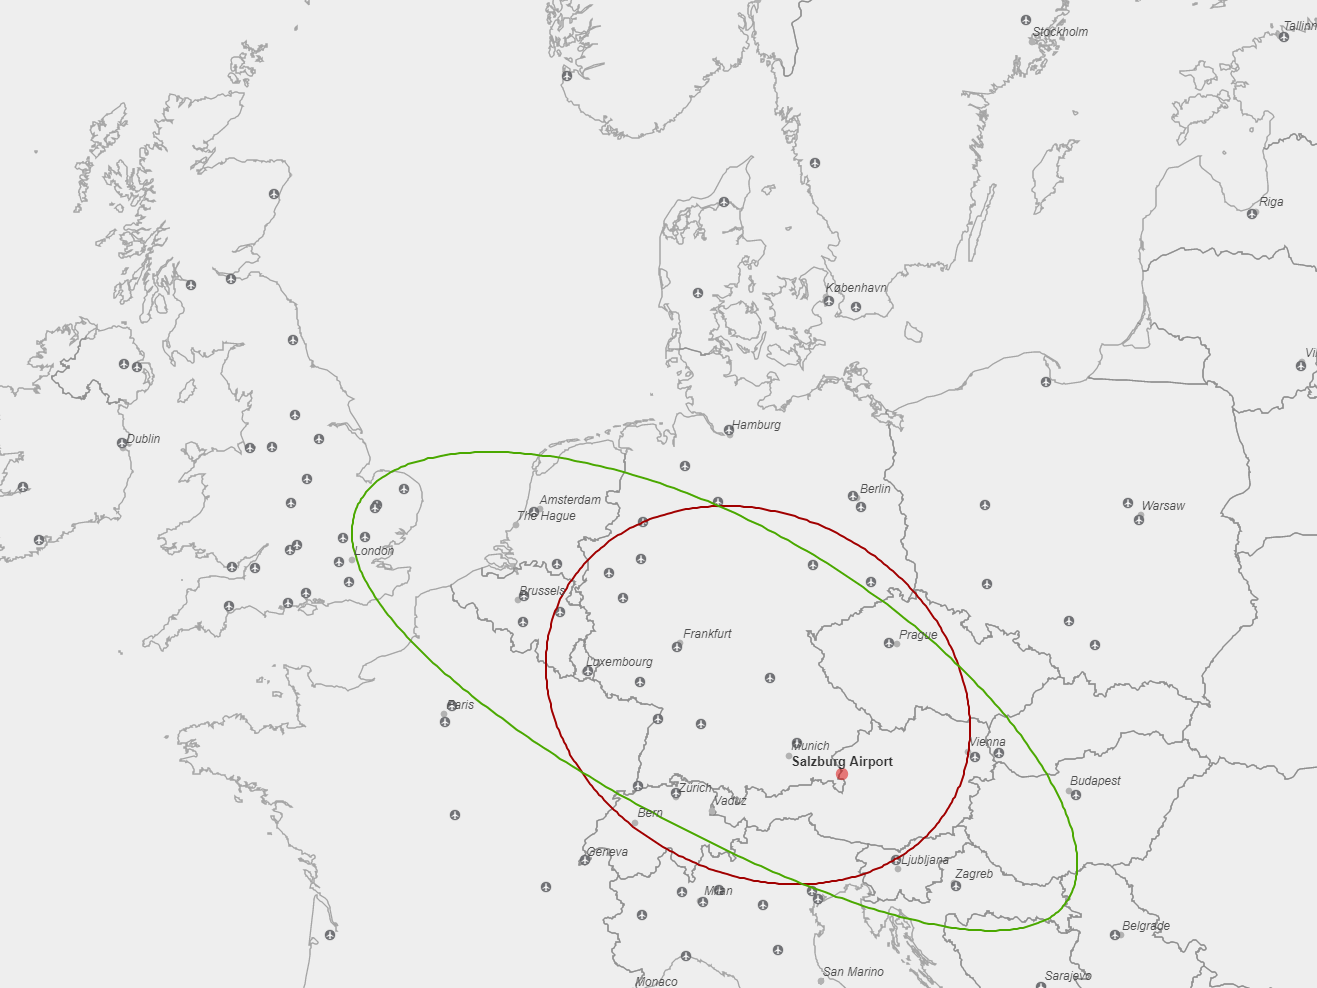
Right: the air-traffic distribution of May 2019 (green) and 2020 (red).
In addition, live data provided by OpenSky Network was retrieved from their API and integrated into the web application.

