
This poster was created as the final project for the course Thematic Cartography in my third semester of CDE.
For the final project of the Thematic Cartography course, the students were asked to use the skills they had acquired during the semester to independently create a poster from scratch. The poster had to include three maps, complementary text descriptions and infographics about the students and their country of origin. The resulting product will be placed as a poster in the faculty building in Olomouc and presents the students of the CDE program and their home countries.
The maps were created in ArcGIS Pro and later incorporated and further processed in a Adobe Illustrator.

Map I – Physical Map of Germany
For the reader to get an overview about geography of Germany I decided to include detailed a physical map of the country. In the process of creating this map I found two reasons that made it easier for me to work on this map compared to physical maps of other countries. Firstly, I am familiar with the overall geography of my country – the most important cities, regions and topographic characteristics are well-known to me and therefore easier to emphasize or to inspect the accuracy. Second, the search for the required geospatial data was much easier because I was familiar with the relevant sources, navigating the websites in my native language was much easier, and aspects such as special characters, correct spelling and metadata did not pose any problems. In previous projects, for example the creation of a physical map for the Czech Republic, I had some problems with this because of the for me unknown country and language.
The background of the map is a classified SRTM height dataset, combined with a corresponding hillshade. On top of that I placed the Natural Earth populated places dataset, selected and filtered layers and from the DLM1000 dataset of the German Federal Agency for Cartography and Geodesy and several manually created labels for regions and lakes. The challenge here was the selection and filtering of the layers, the creation of a coherent color scheme and the appropriate generalization of the vector data.
In addition to the map, an infographic shows the length of the borders between Germany and its neighboring countries. Based on a free statistic, a bar chart was created in Excel and graphically enhanced in Adobe Illustrator.

Map II – Castles in Germany
While researching on things that Germany is famous for I often found articles about approximated 25,000 castles in the country. I decided to make a map about this and was first challenged to find a complete dataset with all the locations of castles in Germany. The most detailed dataset of the Federal Agency for Cartography only included about 3,200 point locations of castles. QGIS was also by no means complete and a open database called EBIDAT had more than 6000 castles in their dataset but unfortunately only covered half of the area of Germany.
Finally I found a website called alleburgen.de with a very detailed web map with approximately 25,000 listed castles. Unfortunately the website did not offer a download of a spatial dataset of the castles and a reverse engineering to get the data from the website lies beyond my competencies. I then decided to join the table with the total numbers of castles per district on the website with a shapefile of the districts of Germany. On the resulting table I used the dot-density method to create an estimation of the geographical distribution of the castles in Germany.
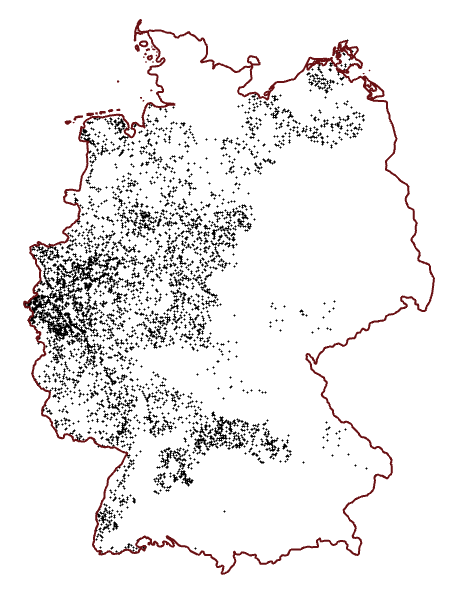


The resulting map is not perfect and some clusters of points seem unrealistic. However the map achieves to give an overview on the spatial distribution of castles in Germany and gives an idea on what 25,000 castles in the area of Germany means. To accompany the map, I decided to provide a simple infographic with two facts about castles in Germany. In addition, the alleged number of 25,000 castles is critically commented on in an accompanying text.

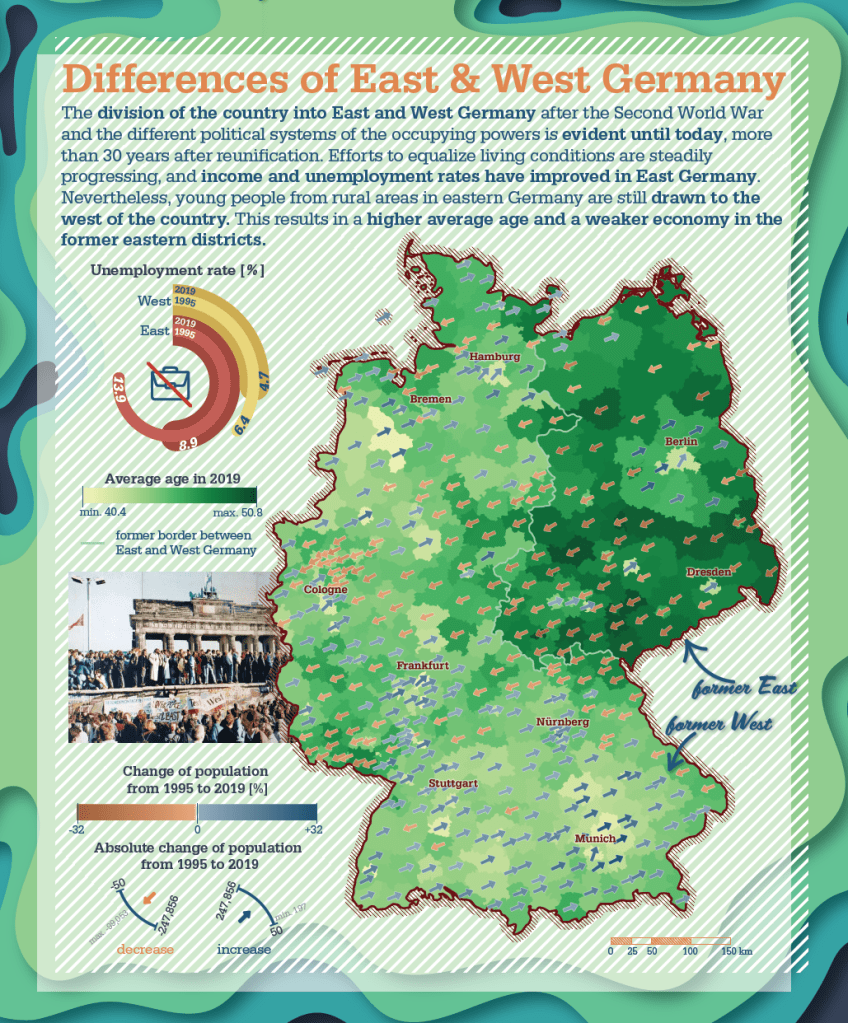
Map III – Differences of East & West Germany
For the third map on my poster I wanted the reader to get a social-economical insight in the country of Germany. For this I chose to show the still existing differences between the former eastern and western part of the country, more than 30 years after the reunification. The map shows two datasets: the average age and the change of population in each district, both retrieved from the Federal Statistical Office of Germany
For the visualization of the change of population I decided to experiment a bit and came up with arrows indication either a increase or decrease of the population in the past 14 years. The color of the arrow indicates on a continous color scale the relative precentual chnage of population, whereas the orientation and angle of the arrow is used to show the absolute change of population in the districts. Often densely populated places like the labeled major cities all show an high relative increase of population indicated by dark blue arrows as well as high absolute increase of population shown by the steep angle of the arrow.
The conception of this method of visualization, the necessary calculations of the data (for example to calculate the angles), as well as the design of an easy-to-read legend were the biggest challenges with this map. The result, however, is an extraordinary and unique map with three key figures per district and thus a large amount of information that can be set in relation.
The symbolizations of both datasets show a significant difference between districts in the eastern and the western part of Germany.